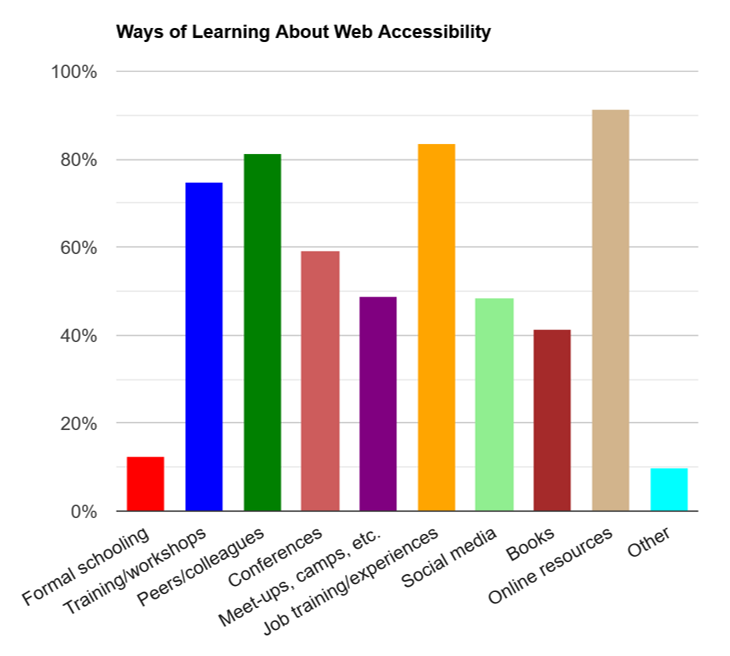
In this example, the data presented in the image is too long or complex for an ALT attribute. Instead, the data is represented in an accessible table on the same page, and the ALT text informs the user of this. Note that data visualizations are generally considered to present accessibility barriers and should be accompanied by either an accessible version of the data or a detailed extended description.
| Response | % of Respondents |
|---|---|
| Formal schooling | 12.5% |
| Training or workshops | 74.8% |
| Collaboration with peers or colleagues | 81.1% |
| Professional conferences | 59.2% |
| Meet-ups, camps, unconferences, or other less formal conferences | 48.7% |
| On-the-job training or experiences | 83.4% |
| Social media | 48.4% |
| Books | 41.2% |
| Online resources—Stack Overflow, WebAIM.org, etc. | 91.3% |
| Other | 9.8% |
ALT: "Bar chart showing methods of learning about web accessibility. Data is represented in the following table."
Source: WebAIM: Survey of Web Accessibility Practitioners #3 Results.